DIGITAL DATA SYNTHESIS TOOL
Reimagining a new way to synthesize and interact with data, collectively, on an interactive touch surface
Client/Collaborators
Graduate Thesis
Company/Partner(s)
Alan Price
Approach
Exploratory/Generative Research Through Making and Testing
Methods/Tools
Illustrator, Unity
OBJECTIVE
Explore a new way (beyond post-it notes) to engage teams in collective discourse, synthesis, and shared understanding using a digital touch-table tool.
OUTCOME
A working digital tool prototype that:
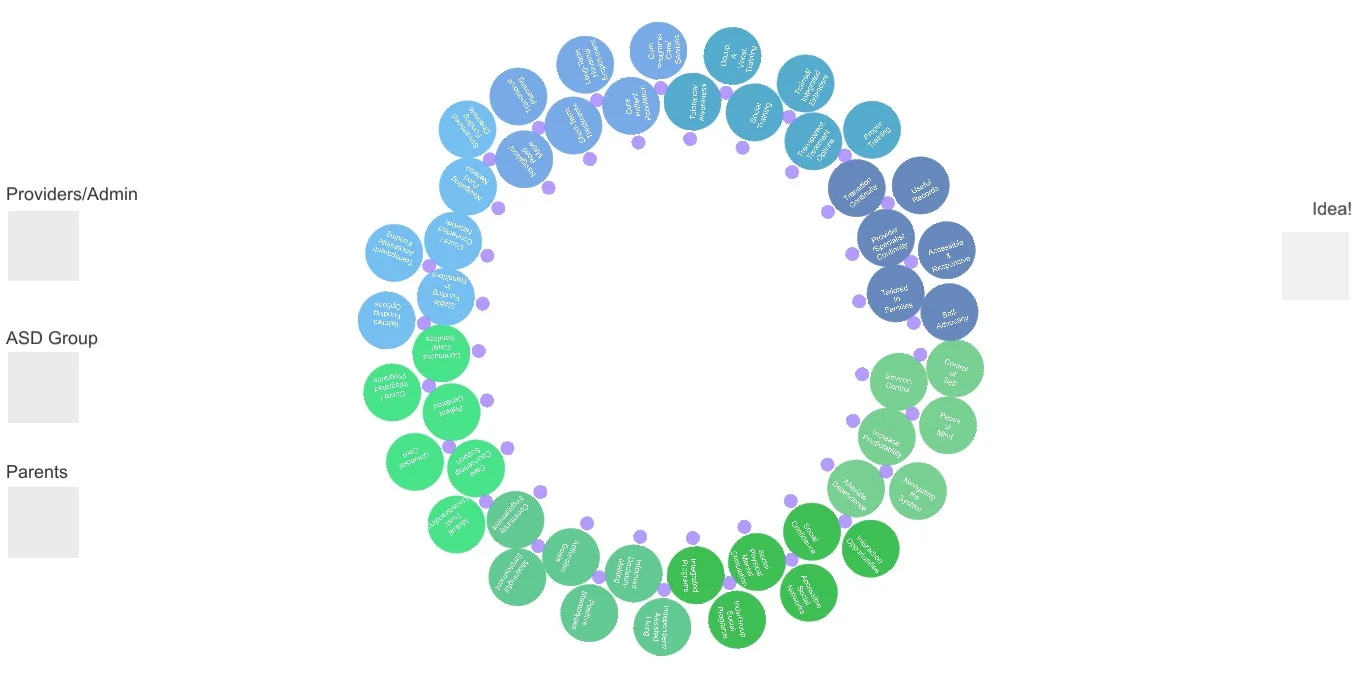
Organizes and presents collected research data in a single space (The ring of ‘data nodes’ can be increased/decreased in size and rotated for easier viewing.)
Facilitates the prioritization of shared/unique goals from multiple points of view (Each node can be moved independently, allowing individuals/teams to prune/cluster key data. The scale of each node visually increases in size with the addition of a stakeholder ‘vote’ or dot.)
Allows individuals/teams to draw connections between data points in order to identify relationships and/or root problems (Directional lines can be drawn between/among nodes.)
Creates a collaborative game-like experience (Data nodes are designed to bounce off of one another in a playful way. Suggestions for new clusters, lines that can be drawn, and the ability to add/customize new nodes gives the user(s) control of the canvas.)
Stimulate shared engagement and critical making (Designed on a touch-table, the intent is for small groups to work collaboratively to draw out collective meaning/understanding and make sense of the data that has been collected through hands-on interaction and verbal discourse. This prototype was designed for meaning, not to be found at the end, but during the process of making sense, collectively.)
Future opportunities for further development include (but are not limited to):
Networking – shared touch device and individual touch devices
Organizing visual clutter
Macro views (zooming out) and micro views (zooming into clusters)
Audio and visual recording of the process
Pause and edit features with time-lapse

Suggestive clusters emerge (dotted circles) when nodes are placed in proximity to one another.

New clusters can be formed and labeled to indicate common patterns/trends.
PROCESS
Research and Wireframing
Background research was conducted on human-computer interaction, gamification, data visualization etc., Illustrator was used to explore visual organization, manipulation, and progression of use.
Iterative Prototyping
Prototypes were built in Unity with Alan to explore various ways the data could be organized, presented, and manipulated that would be most engaging and legible. A play-test of the digital prototype was done in a workshop setting. The digital tool failed, but we discovered weak points and opportunities to improve functionality and usability.
Final Revisions
Final revisions to the digital prototype were made after further experiments and another round of play-testing.

Data visualization inspiration.

Exploring various ways to organize/present data.

Early concept made up of wedges and connector lines was not as forgiving or flexible as the final concept.

Final concept. Stakeholder needs (blue) and goals (green) pulled in automatically from Excel and represented as interactive data nodes. Idea nodes (red) can be created and pulled in. Stakeholder “voting” icons (left) can be placed on nodes to increase their size (prominence).
